ref.otel.help
Good practices operating OpenTelemetry collectors
Author: Michael Hausenblas
Contact:
mh9@o11y.engineeringLast update: 2022-07-30
This document describes good practices operating OpenTelemetry collectors. The target audience for this document includes platform operators and devops/SRE roles that deploy OTel collectors for the telemetry of their workloads, such as containerized microservices or on-premises monoliths.
I assume you have a basic familiarity with OpenTelemetry and cloud native environments like Kubernetes or AWS Lambda. Corrections or suggestions are welcome!
Introduction
TBD.
Distributions
When it comes to distributions you have three options:
- Use the upstream, pre-built distro.
- Choose a vendor distro, for example, ADOT.
- Roll your own distro, using
ocb, the OpenTelemetry Collector Builder.
Let’s have a look at pros and cons for each option:
Health and Performance Monitoring
The OTel collector provides built-in mechanism for monitoring and troubleshooting. It provides rich telemetry, configurable via the service section in the config:
service:
  telemetry:
    logs:
      level: debug
    metrics:
      level: detailed
      address: 0.0.0.0:8888
...

extensions:
  pprof:
    endpoint: localhost:1777
...

exporters:
  logging:
    loglevel: debug
...
Logs
You can get collector logs, for example, in a Kubernetes setup:
$ kubectl logs deployment/adot-collector                                                                                                                                                                                                                                                                            2022/07/02 12:21:49 AWS OTel Collector version: v0.19.0
2022/07/02 12:21:49 found no extra config, skip it, err: open /opt/aws/aws-otel-collector/etc/extracfg.txt: no such file or directory
2022-07-02T12:21:49.709Z        debug   awsutil@v0.54.0/conn.go:61      Using proxy address:    {"kind": "exporter", "data_type": "traces", "name": "awsxray", "proxyAddr": ""}
2022-07-02T12:21:49.709Z        debug   awsutil@v0.54.0/conn.go:130     Fetch region from commandline/config file   {"kind": "exporter", "data_type": "traces", "name": "awsxray", "region": "eu-west-1"}
2022-07-02T12:21:49.709Z        debug   awsxrayexporter@v0.54.0/xray_client.go:51       Using Endpoint: %s  {"kind": "exporter", "data_type": "traces", "name": "awsxray", "endpoint": "https://xray.eu-west-1.amazonaws.com"}
2022-07-02T12:21:49.709Z        debug   awsutil@v0.54.0/conn.go:61      Using proxy address:    {"kind": "exporter", "data_type": "metrics", "name": "awsemf", "proxyAddr": ""}
2022-07-02T12:21:49.709Z        debug   awsutil@v0.54.0/conn.go:130     Fetch region from commandline/config file   {"kind": "exporter", "data_type": "metrics", "name": "awsemf", "region": "eu-west-1"}
2022-07-02T12:21:49.709Z        warn    awsprometheusremotewriteexporter@v0.54.0/factory.go:50  Deprecation notice: The AWS PRW Exporter will be removed in the near future, see the README and the CHANGELOG for more information.     {"kind": "exporter", "data_type": "metrics", "name": "awsprometheusremotewrite"}
2022-07-02T12:21:49.709Z        info    service/telemetry.go:107        Setting up own telemetry...
2022-07-02T12:21:49.710Z        info    service/telemetry.go:146        Serving Prometheus metrics {"address": ":8888", "level": "detailed"}
2022-07-02T12:21:49.711Z        info    extensions/extensions.go:42     Starting extensions...
2022-07-02T12:21:49.711Z        info    extensions/extensions.go:45     Extension is starting...   {"kind": "extension", "name": "health_check"}
2022-07-02T12:21:49.711Z        info    healthcheckextension@v0.54.0/healthcheckextension.go:44 Starting health_check extension     {"config": {"Port":0,"TCPAddr":{"Endpoint":"0.0.0.0:13133"},"Path":"/","CheckCollectorPipeline":{"Enabled":false,"Interval":"5m","ExporterFailureThreshold":5}}}
2022-07-02T12:21:49.711Z        info    extensions/extensions.go:49     Extension started.      {"kind": "extension", "name": "health_check"}
2022-07-02T12:21:49.711Z        info    extensions/extensions.go:45     Extension is starting...   {"kind": "extension", "name": "pprof"}
2022-07-02T12:21:49.712Z        info    pprofextension@v0.54.0/pprofextension.go:71     Starting net/http/pprof server      {"config": {"TCPAddr":{"Endpoint":"localhost:1777"},"BlockProfileFraction":0,"MutexProfileFraction":0,"SaveToFile":""}}
2022-07-02T12:21:49.712Z        info    extensions/extensions.go:49     Extension started.      {"kind": "extension", "name": "pprof"}
2022-07-02T12:21:49.712Z        info    extensions/extensions.go:45     Extension is starting...   {"kind": "extension", "name": "zpages"}
2022-07-02T12:21:49.712Z        info    zpagesextension/zpagesextension.go:64   Registered zPages span processor on tracer provider
2022-07-02T12:21:49.712Z        info    zpagesextension/zpagesextension.go:74   Registered Host's zPages
2022-07-02T12:21:49.712Z        info    zpagesextension/zpagesextension.go:86   Starting zPages extension   {"config": {"TCPAddr":{"Endpoint":"localhost:55679"}}}
2022-07-02T12:21:49.712Z        info    extensions/extensions.go:49     Extension started.      {"kind": "extension", "name": "zpages"}
2022-07-02T12:21:49.712Z        info    pipelines/pipelines.go:74       Starting exporters...
2022-07-02T12:21:49.712Z        info    pipelines/pipelines.go:78       Exporter is starting... {"kind": "exporter", "data_type": "traces", "name": "awsxray"}
2022-07-02T12:21:49.712Z        info    pipelines/pipelines.go:82       Exporter started.       {"kind": "exporter", "data_type": "traces", "name": "awsxray"}
2022-07-02T12:21:49.712Z        info    pipelines/pipelines.go:78       Exporter is starting... {"kind": "exporter", "data_type": "metrics", "name": "awsemf"}
2022-07-02T12:21:49.712Z        info    pipelines/pipelines.go:82       Exporter started.       {"kind": "exporter", "data_type": "metrics", "name": "awsemf"}
2022-07-02T12:21:49.712Z        info    pipelines/pipelines.go:78       Exporter is starting... {"kind": "exporter", "data_type": "metrics", "name": "logging"}
2022-07-02T12:21:49.712Z        info    pipelines/pipelines.go:82       Exporter started.       {"kind": "exporter", "data_type": "metrics", "name": "logging"}
2022-07-02T12:21:49.712Z        info    pipelines/pipelines.go:78       Exporter is starting... {"kind": "exporter", "data_type": "metrics", "name": "awsprometheusremotewrite"}
2022-07-02T12:21:49.712Z        info    pipelines/pipelines.go:82       Exporter started.       {"kind": "exporter", "data_type": "metrics", "name": "awsprometheusremotewrite"}
2022-07-02T12:21:49.712Z        info    pipelines/pipelines.go:86       Starting processors...
2022-07-02T12:21:49.712Z        info    pipelines/pipelines.go:90       Processor is starting...   {"kind": "processor", "name": "batch/metrics", "pipeline": "metrics"}
2022-07-02T12:21:49.712Z        info    pipelines/pipelines.go:94       Processor started.      {"kind": "processor", "name": "batch/metrics", "pipeline": "metrics"}
2022-07-02T12:21:49.712Z        info    pipelines/pipelines.go:98       Starting receivers...
2022-07-02T12:21:49.712Z        info    pipelines/pipelines.go:102      Exporter is starting... {"kind": "receiver", "name": "otlp", "pipeline": "traces"}
2022-07-02T12:21:49.712Z        info    zapgrpc/zapgrpc.go:174  [core] [Server #1] Server created  {"grpc_log": true}
2022-07-02T12:21:49.712Z        info    otlpreceiver/otlp.go:70 Starting GRPC server on endpoint 0.0.0.0:4317       {"kind": "receiver", "name": "otlp", "pipeline": "traces"}
2022-07-02T12:21:49.712Z        info    otlpreceiver/otlp.go:88 Starting HTTP server on endpoint 0.0.0.0:55681      {"kind": "receiver", "name": "otlp", "pipeline": "traces"}
2022-07-02T12:21:49.712Z        info    zapgrpc/zapgrpc.go:174  [core] [Server #1 ListenSocket #2] ListenSocket created     {"grpc_log": true}
2022-07-02T12:21:49.712Z        info    pipelines/pipelines.go:106      Exporter started.       {"kind": "receiver", "name": "otlp", "pipeline": "traces"}
2022-07-02T12:21:49.713Z        info    pipelines/pipelines.go:102      Exporter is starting... {"kind": "receiver", "name": "prometheus", "pipeline": "metrics"}
2022-07-02T12:21:49.713Z        info    kubernetes/kubernetes.go:325    Using pod service account via in-cluster config     {"kind": "receiver", "name": "prometheus", "pipeline": "metrics", "discovery": "kubernetes"}
2022-07-02T12:21:49.713Z        info    kubernetes/kubernetes.go:325    Using pod service account via in-cluster config     {"kind": "receiver", "name": "prometheus", "pipeline": "metrics", "discovery": "kubernetes"}
2022-07-02T12:21:49.713Z        debug   discovery/manager.go:275        Starting provider       {"kind": "receiver", "name": "prometheus", "pipeline": "metrics", "provider": "kubernetes/0", "subs": "map[adot-collector-agent:{} ho11y:{}]"}
2022-07-02T12:21:49.713Z        debug   discovery/manager.go:275        Starting provider       {"kind": "receiver", "name": "prometheus", "pipeline": "metrics", "provider": "kubernetes/1", "subs": "map[kubernetes-service-endpoints:{}]"}
2022-07-02T12:21:49.715Z        info    pipelines/pipelines.go:106      Exporter started.       {"kind": "receiver", "name": "prometheus", "pipeline": "metrics"}
2022-07-02T12:21:49.715Z        info    healthcheck/handler.go:129      Health Check state change  {"status": "ready"}
2022-07-02T12:21:49.715Z        info    service/collector.go:220        Starting aws-otel-collector...      {"Version": "v0.19.0", "NumCPU": 2}
2022-07-02T12:21:49.715Z        info    service/collector.go:128        Everything is ready. Begin running and processing data.
...
Metrics
You can get metrics in Prometheus exposition format, for example, in a Kubernetes setup you can forward traffic locally:
$ kubectl port-forward svc/adot-collector 8888:8888
In a different session:
$ curl localhost:8888/metrics
# HELP otelcol_exporter_enqueue_failed_log_records Number of log records failed to be added to the sending queue.
# TYPE otelcol_exporter_enqueue_failed_log_records counter
otelcol_exporter_enqueue_failed_log_records{exporter="awsemf",service_instance_id="f4e35993-b0df-4bd4-80ab-554c847f6156",service_version="latest"} 0
otelcol_exporter_enqueue_failed_log_records{exporter="awsprometheusremotewrite",service_instance_id="f4e35993-b0df-4bd4-80ab-554c847f6156",service_version="latest"} 0
otelcol_exporter_enqueue_failed_log_records{exporter="awsxray",service_instance_id="f4e35993-b0df-4bd4-80ab-554c847f6156",service_version="latest"} 0
otelcol_exporter_enqueue_failed_log_records{exporter="logging",service_instance_id="f4e35993-b0df-4bd4-80ab-554c847f6156",service_version="latest"} 0
...
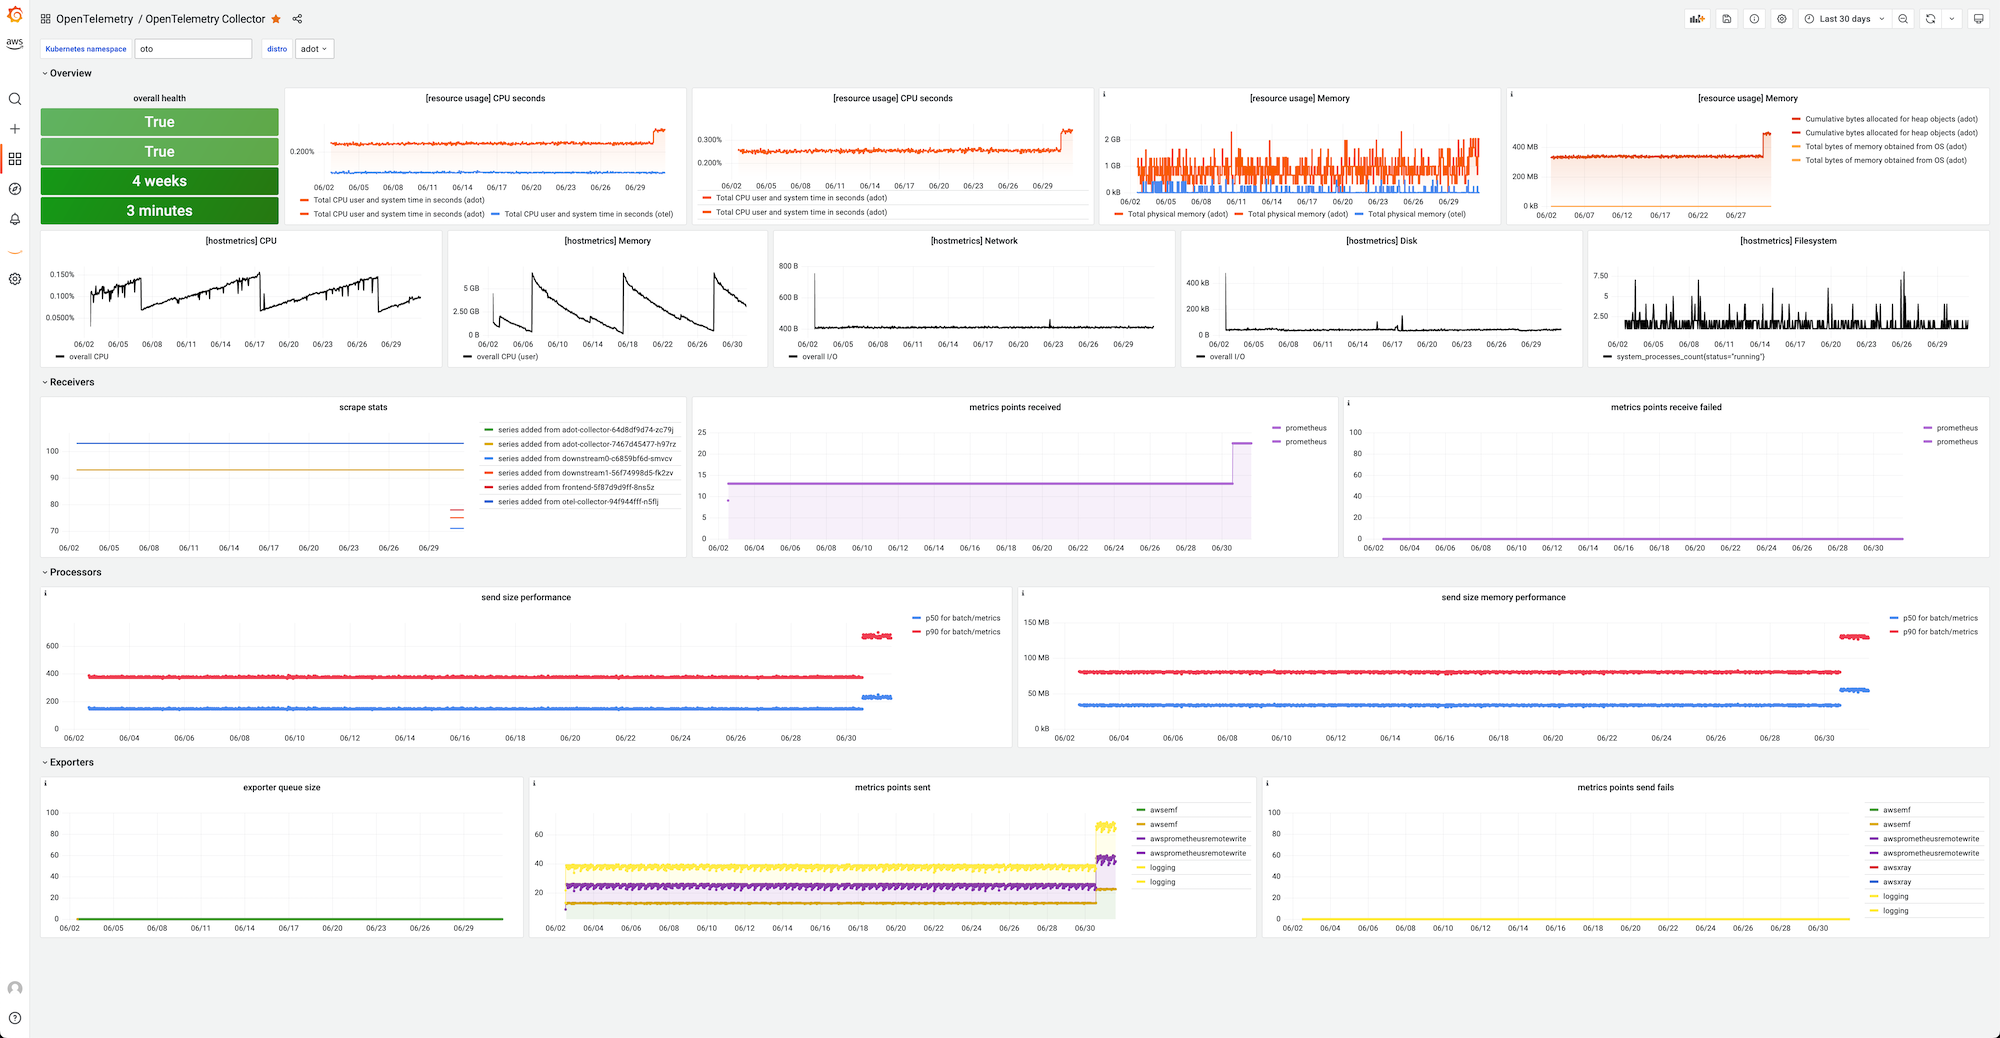
If you use Prometheus to scrape the collector and visualize them in Grafana, an example dashboard might look as follows:
Profiling
You can consume the pprof formatted profiles the OTel collector exposes with one of the Continuos Profiling tools (e.g. CNCF Pixie, Parca, Pyroscope).
Using Parca with the following configuration stored in a file called parca.yaml:
debug_info:
  bucket:
    type: "FILESYSTEM"
    config:
      directory: "./tmp"
  cache:
    type: "FILESYSTEM"
    config:
      directory: "./tmp"

scrape_configs:
  - job_name: "default"
    scrape_interval: "2s"
    static_configs:
      - targets: ["127.0.0.1:1777"]
You can now run Parca like so (assuming you’ve done a port-forward for the OTel collector on port 1777 to the machine where you run Parca):
$ parca --config-path="parca.yaml"
ooooooooo.
`888   `Y88.
 888   .d88'  .oooo.   oooo d8b  .ooooo.   .oooo.
 888ooo88P'  `P  )88b  `888""8P d88' `"Y8 `P  )88b
 888          .oP"888   888     888        .oP"888
 888         d8(  888   888     888   .o8 d8(  888
o888o        `Y888""8o d888b    `Y8bod8P' `Y888""8o

level=info name=parca ts=2022-05-24T13:43:18.645322Z caller=badger.go:100 msg="Set nextTxnTs to 0"
level=info name=parca ts=2022-05-24T13:43:18.64803Z caller=factory.go:49 component=debuginfod msg="loading bucket configuration"
level=info name=parca ts=2022-05-24T13:43:18.648642Z caller=factory.go:49 msg="loading bucket configuration"
level=info name=parca ts=2022-05-24T13:43:18.649058Z caller=server.go:92 msg="starting server" addr=:7070
...
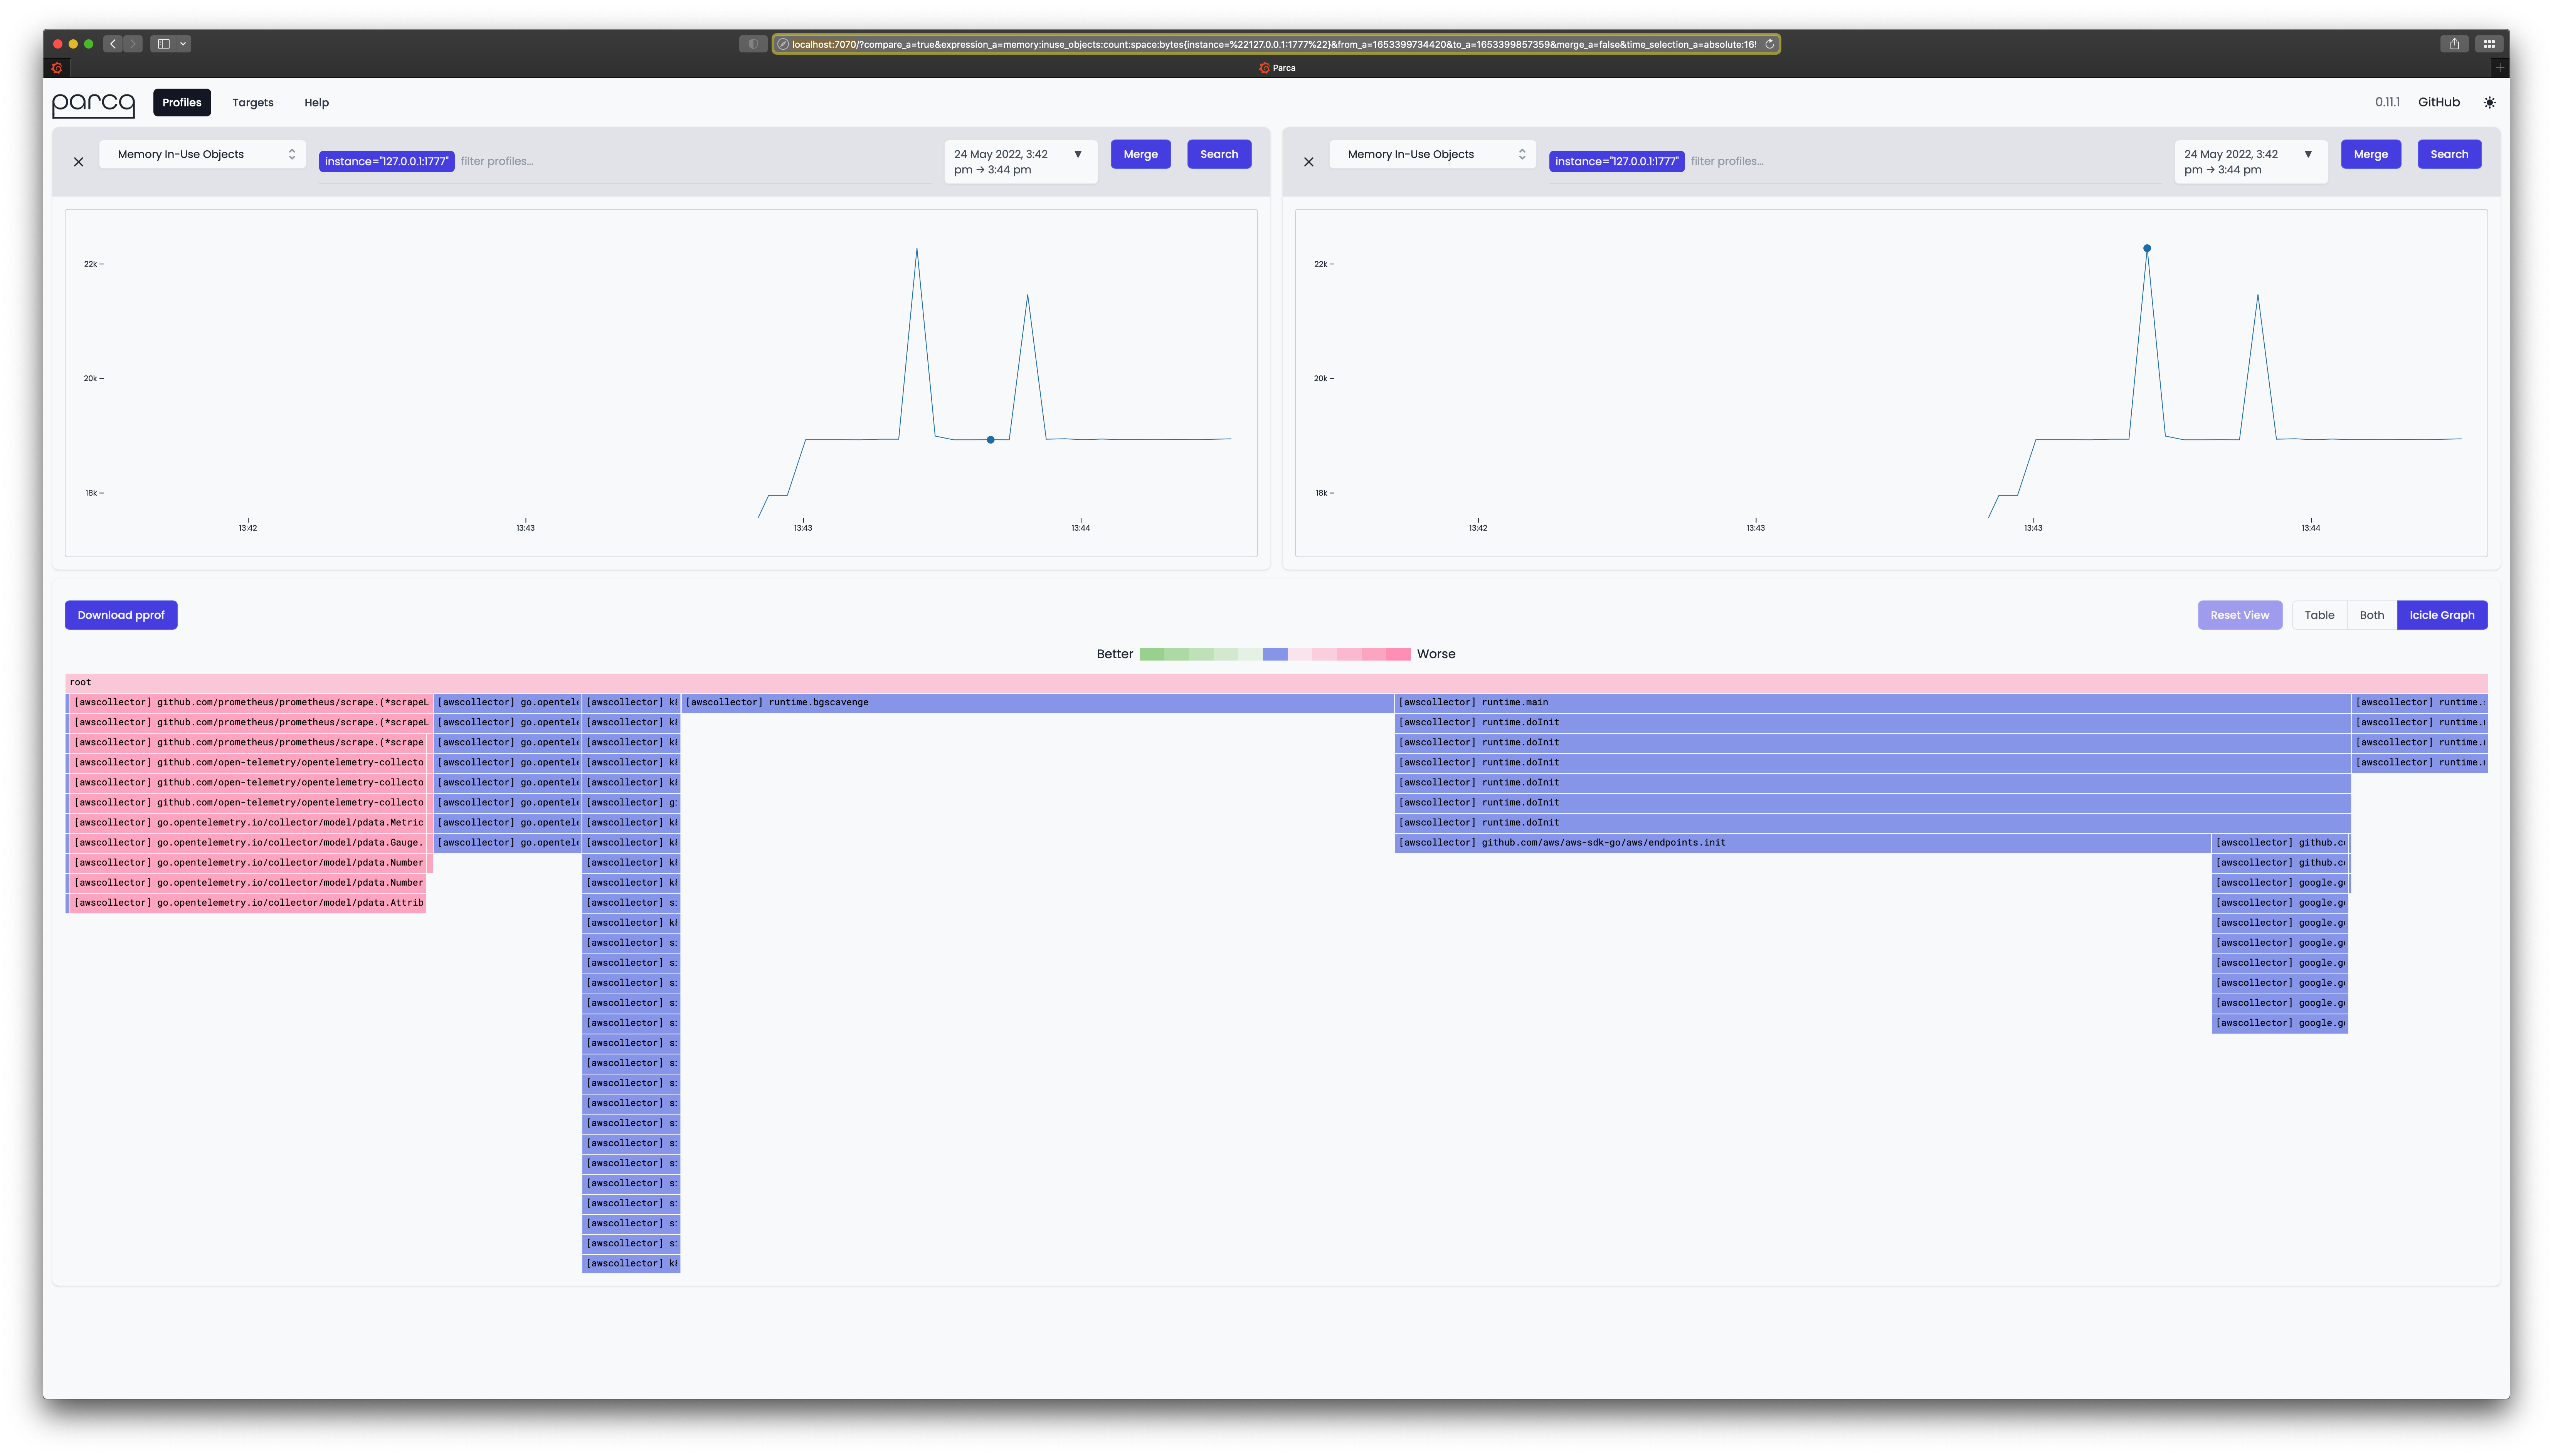
When you now open localhost:7070 in your browser of choice, you should see something like:
Statefulness
Consider running the collector stateless.
Security
VMs
Kubernetes
Further references
- Open Agent Management Protocol (OpAMP) specification
- OpenTelemetry: beyond getting started by Sergey Kanzhelev, 01/2020
- OpenTelemetry Collector & Exporters